Polarization dependence and ordering interference effects in ND filters
Part II of the UMD Physics Quantum Information Group Rotation course (Spring 2009)
Abstract:
Four neutral density attenuators were tested, using a 780 nm diode laser, for polarization dependence and interference effects due to changes in ordering. This was done by directing polarization-tunable laser light through each attenuator (and combinations of 2 to probe for interference effects) to be then collected by a power meter detector. The results indicate the reflective type attenuators tend to have the most pronounced polarization dependence as well as power loss due to interference effects.
Introduction:
As part of the improvements being done on the cavity QED experiment, four neutral density attenuators were tested for polarization and interference problems. An ideal neutral density attenuator is simply a filter that absorbs light equally on all wavelengths. They are characterized by their optical density ND and the type of attenuating material in use (reflective or absorptive). In this case, three attenuators (Labeled A, C, D) were of the reflective type, leaving only one absorptive (Labeled B). The fractional transmittance can be calculated as follows: 10-ND [1].
Experiment:
A 780 nm diode laser was used. It had a temperature controller that was set at 12 degrees Celsius and a current controller set at 100 mA. This produced a beam of roughly 63 mW of power. The experimental setup for the attenuator test consisted of a couple of mirrors, used to steer and properly align the laser beam. The partially polarized beam then passed through a PBS (Polarizing Beam Splitter) and later a half wave plate before arriving at a power meter (See fig. 1).

Fig. 1. Setup for attenuator testing
Firstly, each attenuator (see table 1 for specs) was tested individually. That is, the power of the transmitted laser beam was measured while rotating the half wave plate in intervals of 20 degrees. Naturally, before testing the attenuators, the power meter was tested for polarization dependence. This was done by switching off its internal attenuator (which was also tested and found to have a polarization dependence) and placing one of the attenuators (B) to be tested before the PBS.
Secondly, the attenuators were placed in all possible pairs before the power meter, and discrepancies in power readings due to ordering were recorded.
| Attenuator | ND | 10-ND | Type |
|---|---|---|---|
| A | 2.5 | 0.0032 | reflective |
| B | 2.0 | 0.01 | absorptive |
| C | 2.0 | 0.01 | reflective |
| D | 2.0 | 0.01 | reflective |
Table 1. Specifications of the Neutral density attenuators
Results:
The raw data collected for each attenuator including the power meter was averaged. A percent difference in power was calculated from the average, then plotted vs the half wave plate angle. See below for the results:
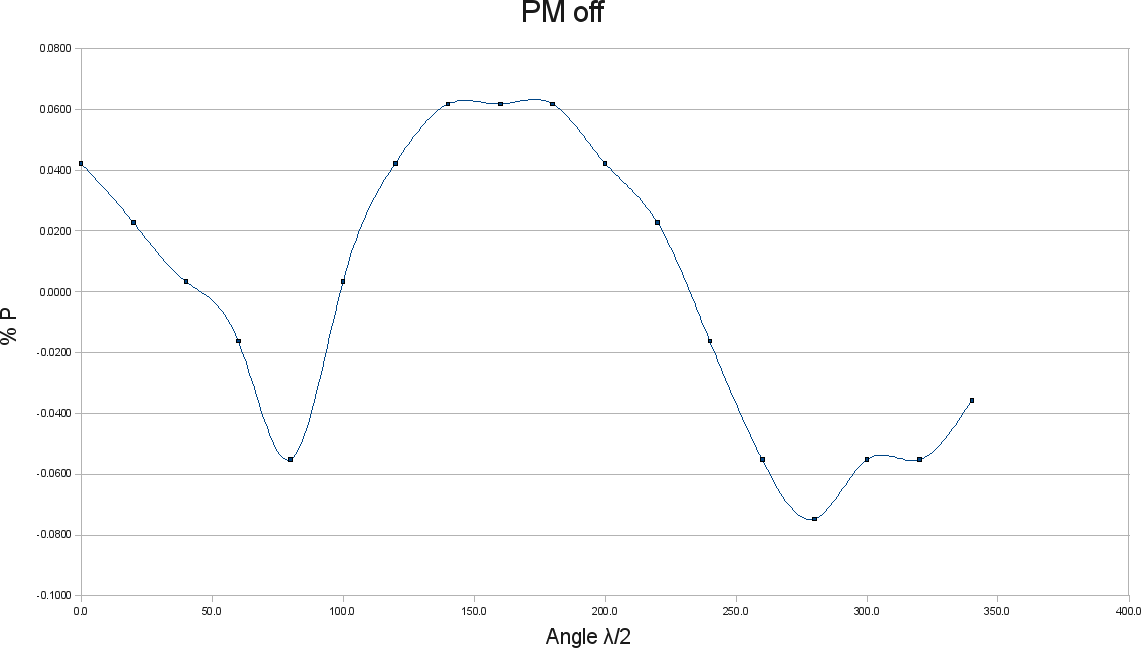
Fig. 2. % Difference in power transmitted versus half wave plate angle (power meter check)
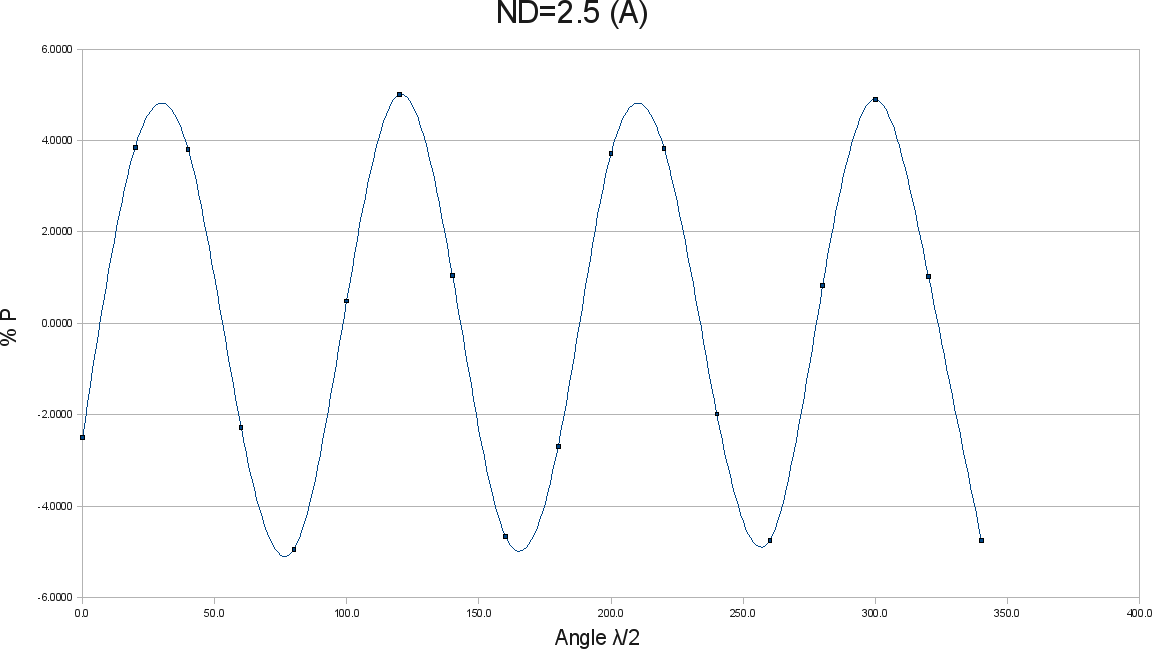
Fig. 3. % Difference in power transmitted versus half wave plate angle (attenuator A)
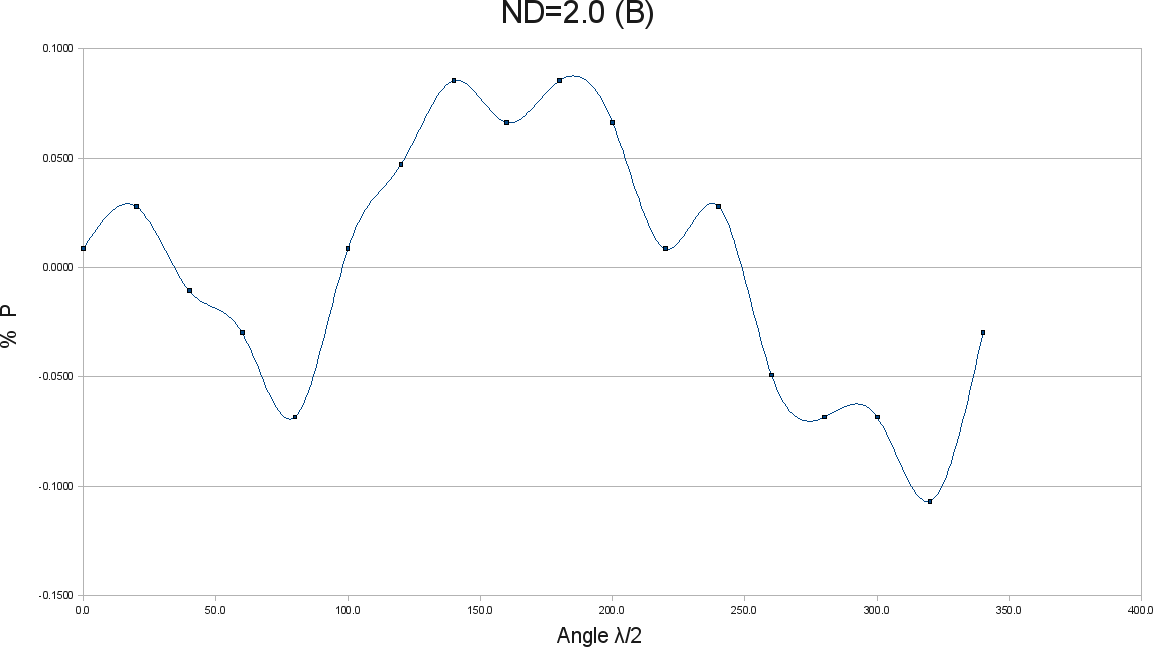
Fig. 4. % Difference in power transmitted versus half wave plate angle (attenuator B)
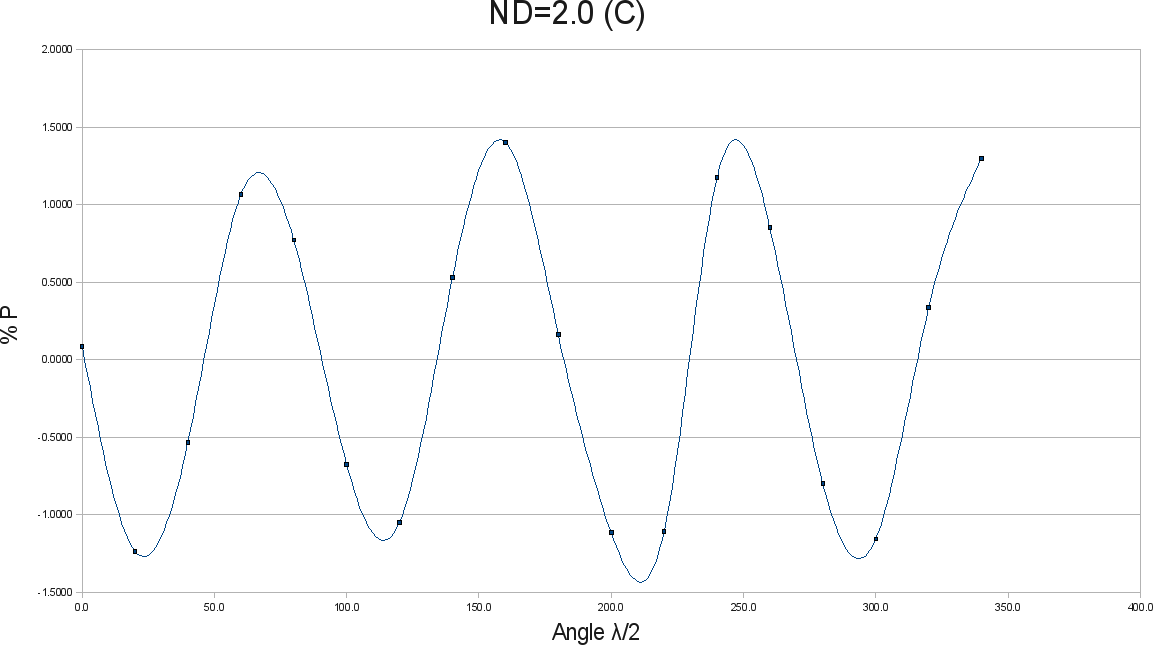
Fig. 5. % Difference in power transmitted versus half wave plate angle (attenuator C)
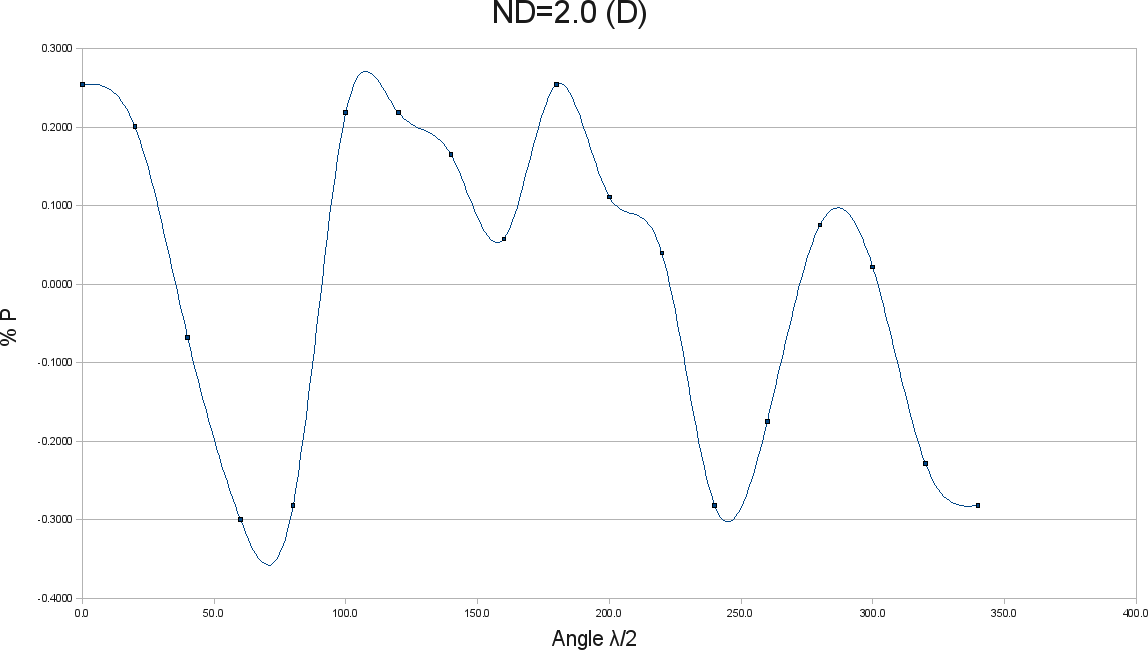
Fig. 6. % Difference in power transmitted versus half wave plate angle (attenuator D)
All the above results pertain the polarization effects. On the other hand, the interference effects were quantified, by taking averages of power readings for differing orders in the attenuator placing. These averages were then substracted, and a percent difference found. The table below summarizes these results.
| Order | A + B | B + A | A + C | C + A | A + D | D + A | B + C | C + B | B + D | D + B | C + D | D + C |
|---|---|---|---|---|---|---|---|---|---|---|---|---|
| Pavg (µW) | 3.9139 | 3.7410 | 7.443 | 8.849 | 4.826 | 6.181 | 10.091 | 8.729 | 4.8296 | 4.8161 | 11.315 | 14.806 |
| % Difference | 4.62 | 18.90 | 28.08 | 15.61 | 0.28 | 30.86 | ||||||
Table 2. Inteference effects in attenuators
Discussion and Conclusions:
By careful inspection of the fig. 2 - 6, it is apparent that attenuator B and the power meter have no polarization preference. The fluctuations in power for these two cases can be explained by laser fluctuations (which were very common). D showed very little dependence (0.20 %). On the other hand, the almost sinusoidal dependence on the angle exhibited by A and C and their high fluctuations from mean (5 % and 1.5 %, respectively) are clear indications of their dependence on polarization.
Once again, attenuator B performed best when probing for interference effects. Table 2 shows that the percent difference was smallest when B was present. It is also worth noting that when C was included, the differences were very high. All these results coincide with the fact that B is the only attenuator that is absorptive.
The results for the first experimental setup indicate the absorptive type attenuator is best for avoiding unwanted polarization and interference losses in power (at 780 nm). Nevertheless, it seems a good idea to probe with a more stable and powerful laser, for one, to be able to probe combinations of at least 3 attenuators and secondly, to avoid power fluctuations as much as possible.
Acknowledgements
I would like to thank David Norris for all his help and guidance in the lab, Prof. Luis Orozco for his help, for suggesting the project and for the opportunity to take this course and Elohim Becerra also for his assistance.
References:
- Wikipedia contributors, Neutral density filter, Wikipedia, the free encyclopedia (2008, February). Retrieved May 10, 2009, from http://en.wikipedia.org/wiki/Neutral_density_filter


